The data on police shootings from recent years is clear and overwhelming with what it tells us: 1.) police haven’t been this safe since the 1870s (not a typo: yes, that is the 19th century), 2). far more Americans are killed by police than criminals kill police, 3.) black Americans are shot and killed in far higher proportions by police than white Americans, 4.) African-Americans are killed far more often in situations where they are not a threat and/or deadly force is not called for, and 5.) American police regularly use lethal violence when it is inappropriate to do so. The problems are systemic, consistent, and nothing new, but new data highlights these disparities more intensely than ever before, giving those who would deny these problems or drag their feet on urgent and needed reform (particularly police and Republican leaders) fewer excuses than they have ever had before. Below is the most in-depth analysis of the new data you will find in a single article. Whether you favor the slogan “blue lives matter” or “black lives matter” or both equally, to not act now will cost more black and blue lives, as I have pleaded before.
Originally published on LinkedIn Pulse July 11, 2016
By Brian E. Frydenborg (LinkedIn, Facebook, Twitter @bfry1981) July 11th, 2016
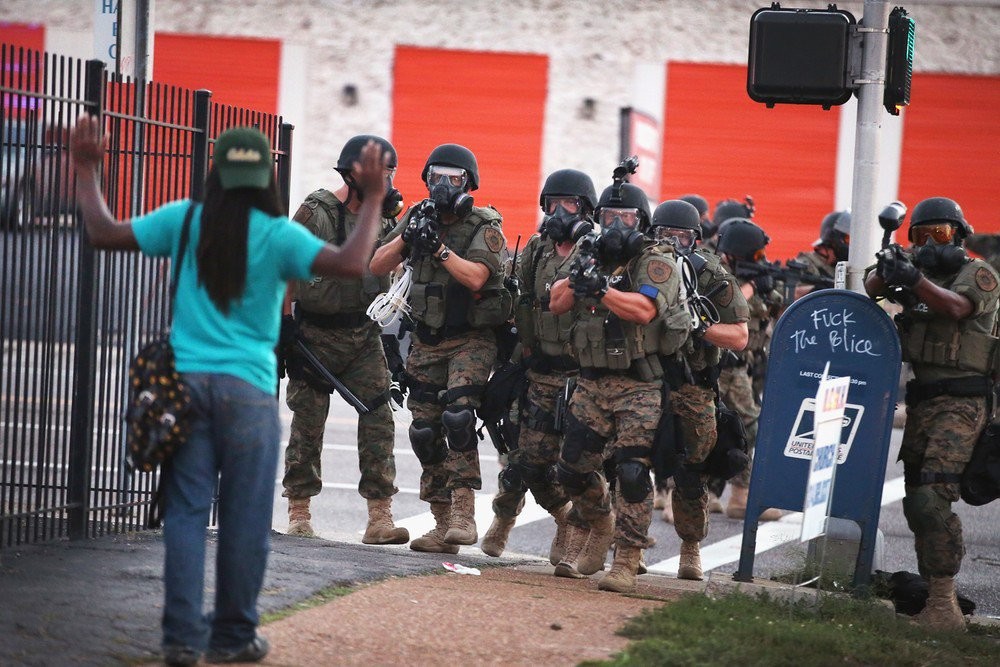
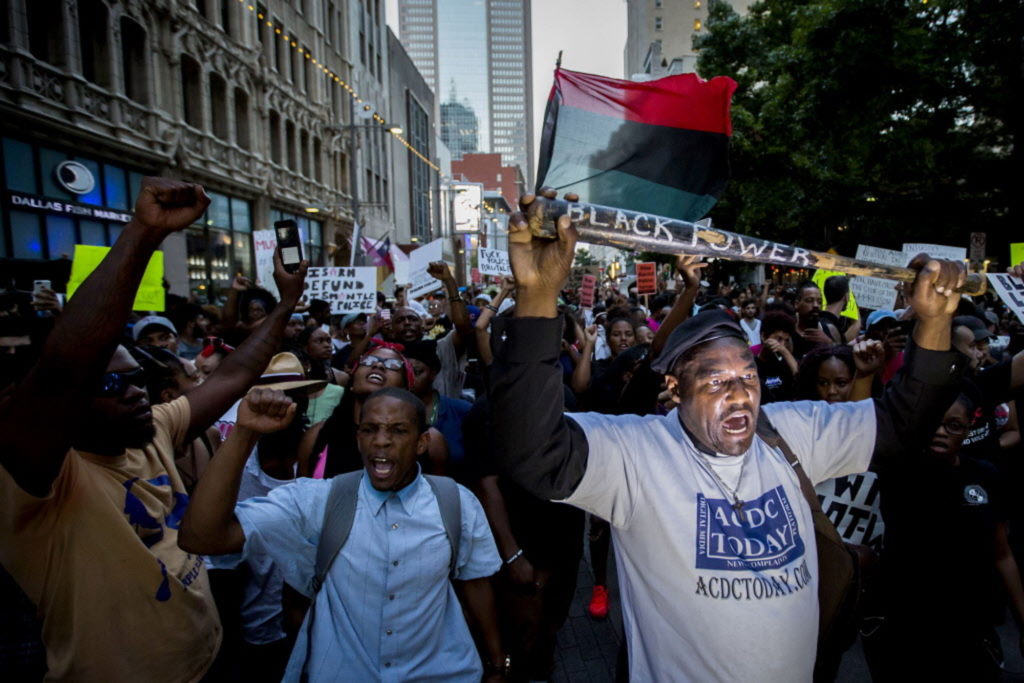
Scott Olson/Getty Images
AMMAN — After recent events (the shootings of Alton Sterling, Philando Castile, of police in Dallas,, and, most recently, the terrorist assault on police in Baton Rouge) the time for action is now. But when acting, an examination of data is the best way to chart a sensible path forward and to provide a real understanding of what is going on. When it comes to police shootings, both by and of police, a look at the available data can tell us some very important, very clear, wholly indisputable things about the state of both police shooting and killing other people and police being shot and killed by other people. Below are some of the clearest trends, among others, from the available data, in this exclusive analysis of the data and the most in-depth available in a single article:
1.) Cops have never been safer from criminals in modern American history
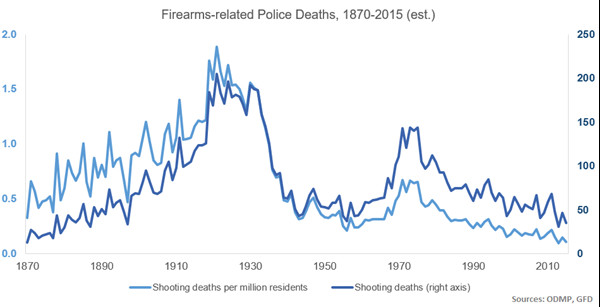
AEI/Mark Perry/Newsweek/Daniel Bier
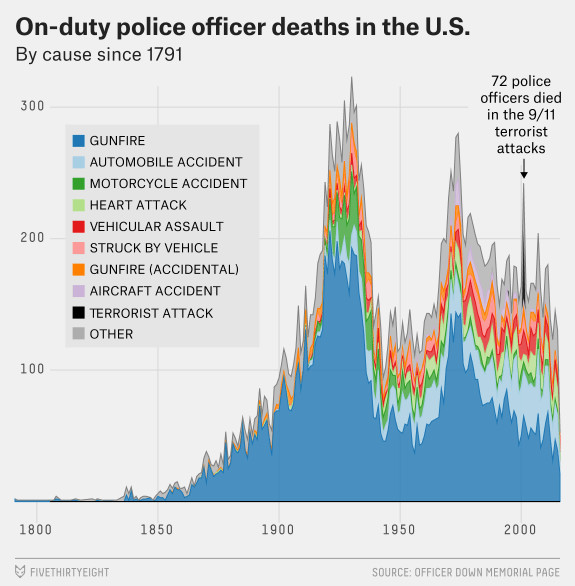
The past few years in America have seen the fewest number of police officers killed by criminals in the line of duty in American history since the 1870s. This is true on multiple levels: it is true as far as the absolute number of police officers being killed, the percentage of all officers being killed, and the proportion of police officers killed in respect to the overall population; all this is also true regarding assaults and injuries sustained by police officers, except the rate of injuries is going up slightly from a historic low. But taken together, clearly, it has never been safer to be an officer of the law in the United States of America, at least for all of our modern history in terms of being attacked by criminals. In fact, being a cop, you have a slightly lower chance of being murdered than the average American and are far safer than residents of cities like Baltimore, Maryland, New Orleans, Louisiana, and St. Louis, Missouri. The number of police killed in the line of duty fell to a record-since-the-19th-century-low 27 officers in 2013, and all recent years averaged together are at a historic low since that period as well. So the idea that some articulate that there is a “war on cops” is false.
2.) Being a cop in America isn’t even one of the top ten most dangerous jobs in America
There are dozens of professions in America that are more lethal than being a police officer, including pretty normal ones like farming, driving taxis or trucks, construction, mining, roofing, collecting garbage, and landscaping.
3.) Police officers kill others far more than they are killed by others
Something that has been irritating for many people trying to point out the problems and disparities that the African-American community faces in its interaction with law enforcement is that people often respond by seeking to downplay the concerns of African-Americans, in part through trying to equate the threats and deaths of police officers in the line of duty with the threats African-Americans face from law enforcement.
There are good records of how many police officers are killed in the line of duty each year, but the same has not been true not true for how many people are killed by on-duty police officers; there is no comprehensive database on those killings, and those statistics are currently mainly supplied voluntarily to the FBI by a small number of the over 18,000 police departments nationwide; less than 3% have been doing so in recent year, the rest choosing not to submit data, but the FBI is planning to dramatically improve this and to implement a new system beginning 2017.
Still, even the data we do have is telling: only 27 police officers died of wounds inflicted with malicious intent (“feloniously killed”) in the line of duty in 2013, the lowest year on record since the 1870s, and while that number went up to 51 in 2014, that, too, was part of an overall trend that is historically low in recent years (48 in 2012, and preliminary data has 41 such police deaths in 2015).
When it comes to people killed by police, as I noted, there was only very incomplete data. Yet finally, over the past few years, various independent organizations/journalists have begun filling in the gaps; the most systematic and comprehensive appears to be The Washington Post’s, which took it upon itself to systematically compile data on police shooting other people since there had, shockingly, been no such successful effort to do this; it started keeping track of all shootings from January 1st, 2015, forward.
For 2015, the Post was able to find and verify over twice the number of killings that were reported by the FBI’s voluntary reporting system, producing a statistic of 990 people killed by on-duty police; compared to the 41 police murdered on duty in 2015 from the FBI’s preliminary data, that, that means that over 24 times more people were killed by police than police were killed by criminals. This number was more than twice the number of shootings that the FBI was able to uncover under its present, very incomplete system. Moving onto 2016, thus far there were 20 police killed by criminals through the first six months of the year, while the Post verified that at least 491 people were killed in the same period, roughly the same ratio for all of 2015.
In other words, far more people are being killed by police than the other way around.
And we can also look at this proportionately in a rough but still quite informative way: there are about 900,000 police officers in the U.S., which means police had about a 0.0045% of being killed by a criminal in 2015. The general U.S. population was estimated at 320 million for the beginning of 2015; removing 900,000 police officers we will say that roughly there are 319 million non-police Americans, and that police killed about 0.0003% of the these Americans in 2015, but it should be reminded that police exist to deal with criminals and protect the citizenry, so this should not be surprising. Still, that means that, again roughly, police are about 15 times likelier to be killed by non-police Americans than non-police Americans are likely to be killed by police.
4.) Black Americans are killed by police in far higher numbers proportionately than white Americans
But now it’s time to bring race and ethnicity into the equation. Of the 990 people killed by police in 2015, 494 were white (a tad under 49.9% of the total), 258 were black (a little over 26%), and a little less than 3% were “unknown.” Non-Hispanic whites made up about 61.6%* of Americans in 2015 or about 196.5 million Americans; this meant that your typical white American has a bit over a 0.00025% chance of being killed by on-duty police; for African-Americans, who comprise about 13.3% of Americans, or a little over 42.4 million Americans, this means that they have a bit over a 0.0006% chance** of being killed by police and are about 2.4 times more likely to be killed by police than white people are (* and **: see Appendix).
Thus far in 2016, 522 people have been killed by police, including 242 white Americans (less than 46.4% of the total) and 129 black Americans (24.7%), comparable to last years’ disproportionate proportions.
Now, for the following statistics taken by the from the Post dataset, keep in mind that African-Americans are only about 13.3% of the U.S. population!
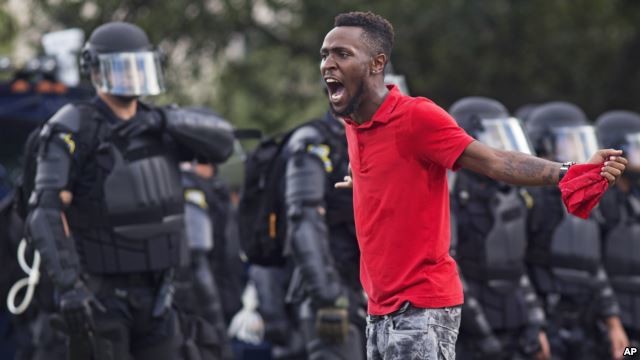
5.) Black Americans are more likely to be shot and killed while unarmed, both proportionately and in absolute terms in 2015, than white Americans
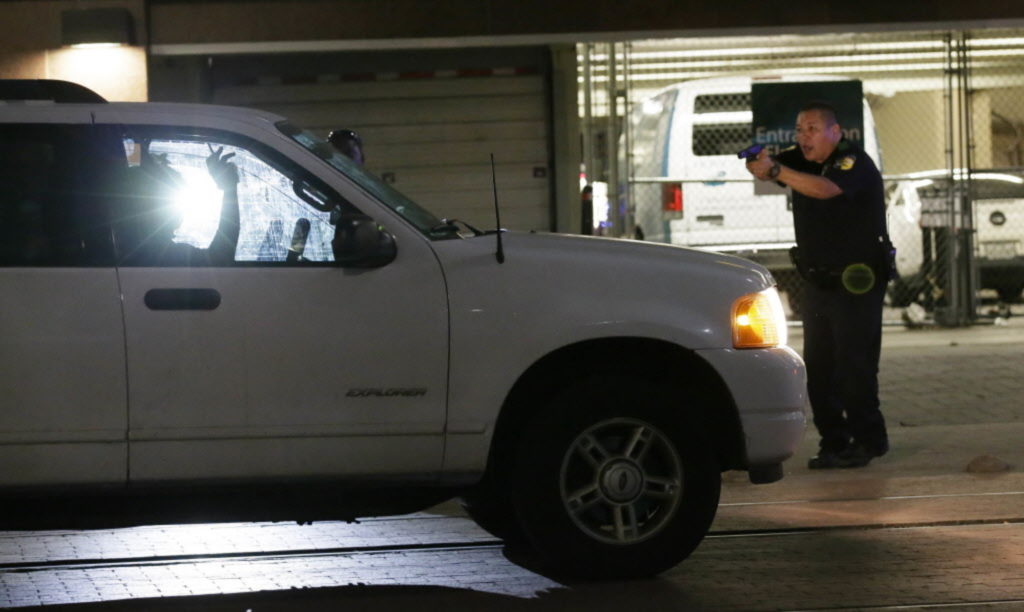
LM Otero
Out of 93 people who were unarmed when shot and killed by police in 2015 (almost 9.4% of those of all who were killed that year, or approaching 1 in 10 of all lethal police shootings, but not including 34 people “armed” with toy weapons), 38 were black (almost 40.9% of all unarmed people killed by police), which is more than the 32 white people who were unarmed when killed (34.4% of all unarmed people killed by police); all this makes a black person killed by police in 2015 18.9% more likely to have been unarmed than a white person killed by police, and in absolute terms well over 18.7% more black people were shot dead unarmed than unarmed whites.
Another way to look at the data is that of the 494 whites killed by police, the 32 killed while unarmed represent about 6.5% of all whites killed by police, while of the 258 African-Americans who were killed by police, the 38 who were killed unarmed are over 14.7% of all blacks killed by police, meaning that an African-American who was killed by police in 2015 was over 2.26 times more likely to have been unarmed than whites people killed by police.
Thus far in 2016, 35 people have been killed by police while unarmed (not including 23 who had toy guns), representing 6.7% of all deaths; 18 were white and 12 were black. This means whites represented over 51.4% of all unarmed people who were killed by police and over 7.4% of all whites who were killed were unarmed; blacks made up almost 34.3% of unarmed people killed and 9.3% of all blacks killed were unarmed, still numbers that are disproportionately bad for African-Americans.
6.) Black Americans are significantly more likely to be shot and killed when not a direct threat than white Americans

LM Otero
Of the 730 people who were killed in the process of attacking either police or someone else in 2015 (about 73.7% of the total killed by police), 394 were white (nearly 54% of this category and a bit less than 79.8% of all whites killed by police), while 183 were black (not quite 25.1% of this category and over 70.9% of all blacks killed by police), but, of the 216 people not categorized as attacking people at the time when they were killed (over 21.8% of all those killed by police, with an additional 44 falling under “undetermined:” 17 white, 12 black), 83 were white (over 38.4% of this category) and 63 were black (a bit less than 29.2% in this category). First of all, just the fact that well over 1 out of every 5 Americans who are killed by police are not in the process of committing an attack while they are killed is quite telling as to the overuse of lethal force by American police by itself, but the racial dimensions make it even more troubling when considered proportionately.
To look at this data in another way as with the last set of statistics, the 83 whites shot and killed when they were a not direct threat out of the 494 whites who were shot and killed overall represent over 16.8% of all whites shot and killed by police, whereas the 63 blacks killed when not a direct threat represent over 24.4% out of the 258 blacks killed by police in 2015. Thus, a black man killed by police in 2015 was over 45% more likely to be not in the process of attacking someone than a white man killed by police.
Furthermore, blacks were a 16.3% higher proportion of the total number of Americans killed who were not direct threats compared to their proportion of the total number of Americans who were in the process of attacking; conversely, whites were a 28.9% lower proportion of all people killed when compared to their proportion of people killed while actually attacking. Additionally, the portion of African-Americans killed while actually attacking was a good bit over 11.1% less than the portion of white people killed while actually attacking; to put it another way, a black person killed by police was 11.1% less likely to be killed when force would actually be likely justifiable in these situations than a white person killed by police, and formed higher portion of people killed when not attacking than they did when people were attacking.
In 2016 thus far, data does not include if an attack was in progress.
No matter how you look at it, then, lethal force is used far less appropriately proportionally when African-Americans interact with the police than when white people interact with police.
7.) Young blacks are killed far more proportionately and even more in absolute terms by the police than white Americans
There were even more black Americans aged 18-29 who were killed by police in 2015 in absolute terms than white Americans the same age: 124 blacks (about 37.6% of all 18-29-year-olds who were shot and killed) to 120 whites (about 36.4% of all 18-29 year olds who were shot and killed); the 124 black young adults represent less than 48.1% of all blacks killed by police, while the 120 white young adults represent almost 24.3% of all whites killed by police, only about half the proportion that age cohort represents in terms of all blacks killed by police in 2015.
So far in 2016, 167 18-29-year-olds have been killed by police: 60 white and 60 black, an equal 35.9% of the total each for this category. For whites, the 60 represent nearly 24.8% of all whites killed, but the same number represents over 46.5% of all blacks killed so far this year, statistics very comparable to last year.
8.) Even though women are only a very tiny fraction of all those shot and killed by police, black women are still shot at a proportionally much higher rate than white women
The vast majority of those shot and killed by police in 2015 were men; only 42 people out of 990, or a little more than 4.2%, were women. Yet of those 42 women, 26 killed were white (61.9% of all women) and 10 were black (23.8%), a comparable proportional disparity to the one between white and black men, though slightly less bad (of male victims, less than 49.4% were white, compared to less than 26.2% being black). For what it’s worth, of the 3 women who were killed that were unarmed (not including 1 who held a toy gun), 2 were black and 1 was white, and of the 16 women killed who were not direct threats, an equal number of 6 black women and 6 white women were killed. This means that out of the 10 black women who were killed, 20% were unarmed and 60% were not a direct threat, compared to the 26 killed white women of whom only over 3.8% were unarmed and not quite 23.1% were not direct threats; this means that a black woman who was killed by police 2015 was more than 5.26 times more likely to be unarmed than a white woman killed by police, and that black woman killed by police was almost 2.6 times more likely to not be a direct threat than a white woman killed by police. Though the samples are very small, as is the case with black men, the use of lethal force against black women who were either unarmed or not serious threats was grossly disproportionate.
So far in 2016, 25 women have been killed by police: 11 white women (44% of all women killed) and 8 black women (32% of all women killed). In terms of being unarmed and excluding two women killed with toy guns, of the 3 women killed with no weapons on them, 1 was black and 2 were white. Even with such tiny numbers, the proportional disparity is obvious considering the difference in the white and black population sizes.
Smiley N. Pool
*****
Conclusion
Even allowing for the fact that Africans Americans are the subjects of 28.7% of all arrests (vs. 69.4% for whites) and, specifically, are the subjects of 37.7% of all arrests related to violent crime in America (compared to 59.4% for white Americans), the disparities in how often black Americans are lethally shot by police and how lethal force is used disproportionately against blacks in situations where lethal force is not called for do not add up.
Additionally, the societal conditions that drive many blacks into crime are a whole other series of issues that must also be addressed in order to give full meaning and context to the above statistics. Factors that must be considered include: that most whites by far and most black by far are murdered by members of their own race; that poor whites and poor blacks tend to be victimized by at least some types of violent crime at roughly the same rates; that poverty especially as a factor among other structural factors in determining the likelihood of a person committing a crime is enormous and begs further statistical analysis, and may even be the determining factor; that the white public harbors systemic bias against blacks; that blacks proportionately suffer from systemic, pervasive, and long-term poverty, unemployment, and poor educational prospects at far higher rates than whites; that there was a long historical tradition of using law enforcement—and the justice and prison system—as a weapon against—and way to exploit—the black community; that today’s criminal justice system is still deeply biased against blacks on everything from systemic and endemic mass incarceration to sentencing disparities to arrest, prosecution, and conviction rates.
Ultimately, there is a sickness of racism and bias in America’s police forces and the criminal justice system as a whole, and it has been going on for far too long. Even after the recent killings of police in Dallas and even today in Baton Rouge, American police in 2016 are still safer than they have been historically since the 1870s unless there is soon an explosion of anti-police violence in the next few months; even allowing for a modest increase in police deaths this year, the current average is still so historically low that it would take a lot for police safety to go back up to more historically dangerous levels.
Obviously, individual acts of terror targeting police deliberately are heinous and deplorable. What is even more unacceptable is the constant level of police violence perpetrated by police against African-Americans (who, unlike police who choose their profession and choose to put themselves in harm’s way, cannot choose to be black or not), as the numbers here make abundantly clear. America ignores these numbers, what they represent, and the rage they stir to catastrophic consequences.
Short answer: “No, not yet…”
_____
Appendix
*A discussion of this statistic of what makes up white Americans is necessary: in some ways, the racial disparities highlighted above are actually higher because “white”-Americans include a growing number of Hispanics who identify as white and primarily white, who are light-skinned, are of European ancestry, and say people seeing them in public would think they are white; these people are basically assimilated in the ways Irish, Poles, and Italians—considered non-white in the past—assimilated over time. If a typical American would look at them and consider them white, so would the typical police officer. And to make it even more confusing, Hispanic is an ethnicity and not a racial category. So, somewhere in between the percent of white Americans that are non-Hispanic white (61.6%) and everyone who checked white and only white in the “race” category, where Hispanic is not an option for that category (2015 projection based on 2010 census: 77.1%), there is the true number/percent of Americans who are actually white, admittedly closer to the former rather than the latter since a majority of American Hispanics consider their Hispanic identity as part of their racial makeup, though a significant minority do not.
The government census has not been able to clearly identify exactly what these people identify with most strongly in their previous sets of questions, and will be updating the census in 2020 to get a better sense of this, when Hispanic will be included as a primary identity, next to white, black, Asian, and other primary categories. Still, because of this confusion, for the purposes of this articles I am sticking with the non-Hispanic whites (the 61.6% figure) when I talk about whites out of caution, but will look forward to better data in 2020. So, keep in mind, as bad as these disparities are, they are actually worse, possibly significantly worse, but this is hard to measure with current data.
** A shameful aspect of this that would actually make the chance of a black American being killed by police even worse is that around 900,000 to almost 1 million African-Americansare incarcerated, and are basically taken out of the population eligible to be shot by police; if we factored out 900,000-1 million African-Americans (over 2.1% to less than 2.4% out of the black population), then the odds of being killed as a black American, particularly a black male (the vast majority of black prisoners are male), would be higher.
If you appreciate Brian’s unique content, you can support him and his work bydonating here.
Here are many more articles by Brian E. Frydenborg. If you think your site or another would be a good place for this content please do not hesitate to reach out to him! Feel free to share and repost on LinkedIn, Facebook, and Twitter (you can follow him there at @bfry1981)